This time we have a Reverse Code Engineering challenge . This challenge is really useful for beginners who like to jump head-first into RCE.
Challenge info: (link to challenge)
challenge description
.
The file provided is called "basic_re", and has no extension. Lets check in a text editor or hex editor to see if it has a magic number in its header. It does..
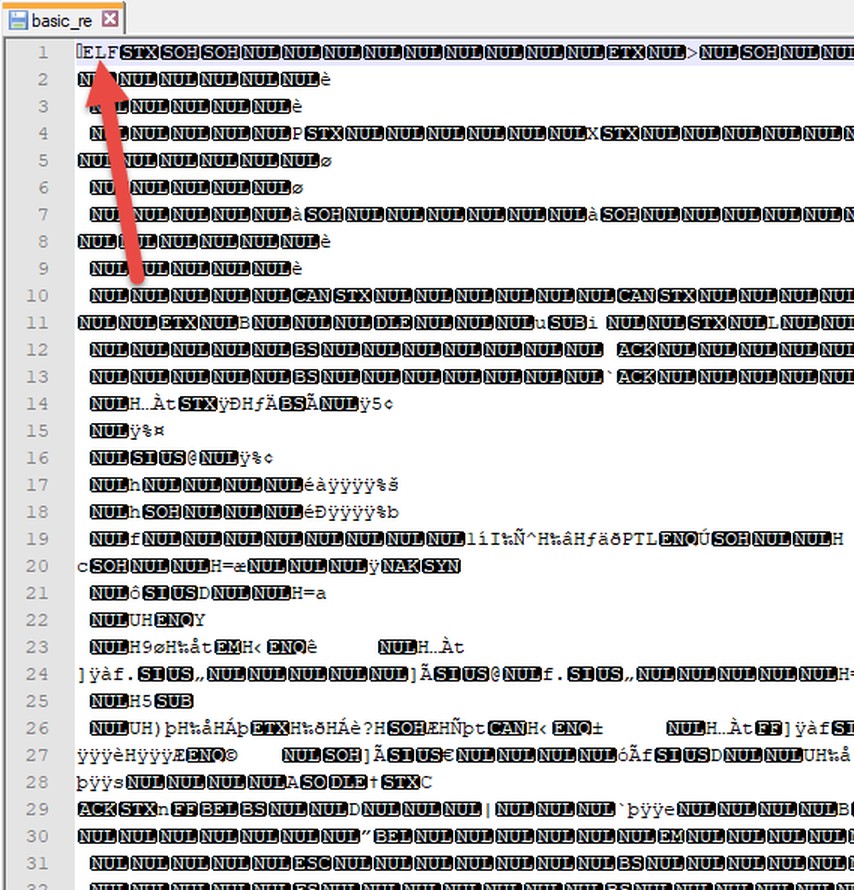
ELF magic_number
For confirmation, we could run TRiD on it:
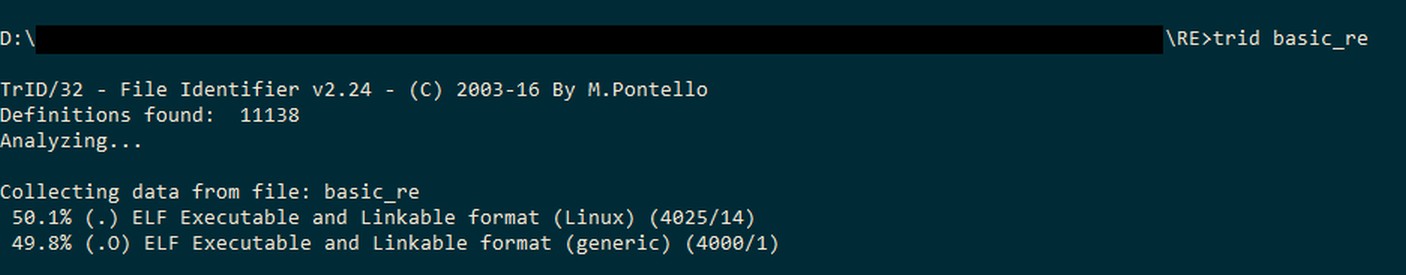
TRiD says it's an ELF file
So it's an ELF file. How to approach it?
We should run it on our Linux VM to see what it does, then we could disassemble it (and debug it if needed) using IDA free or Radare2, GDB, or any tool. Lets go..
.
I'll try Radare2 first. Load the file first into radare2..
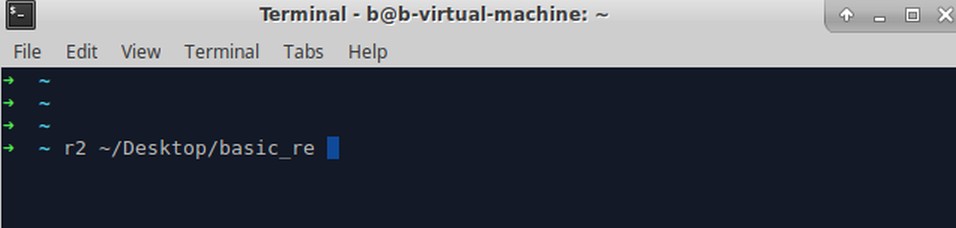
loading our file into radare2
Then we'll continue with the help of this wonderful radare cheat-sheet.
Lets analyze functions, then list the names of all of them..

"aa" analyze all
"afl" list functions
We've got a "main( )" function.. Lets check it out in the graph mode..
We seek to it first (notice the change of the address on the left), and then use "VV" command.
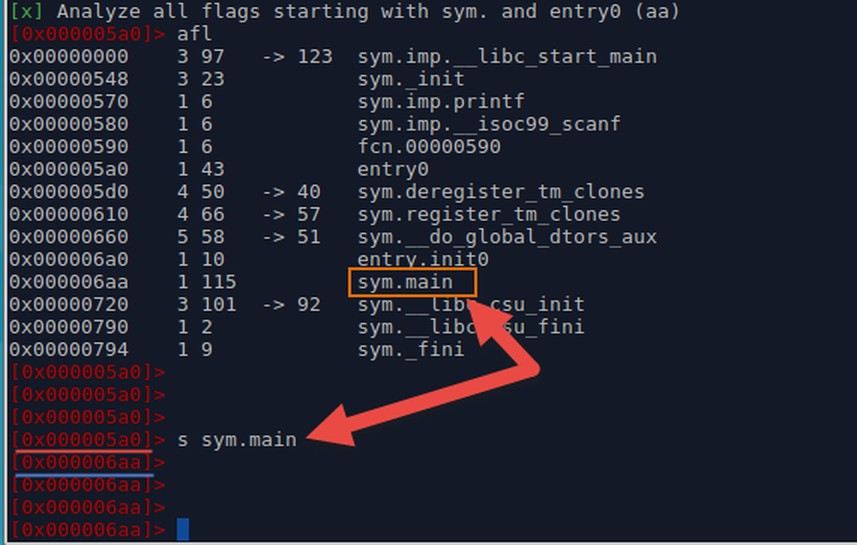
"s" seek
This is what we get...
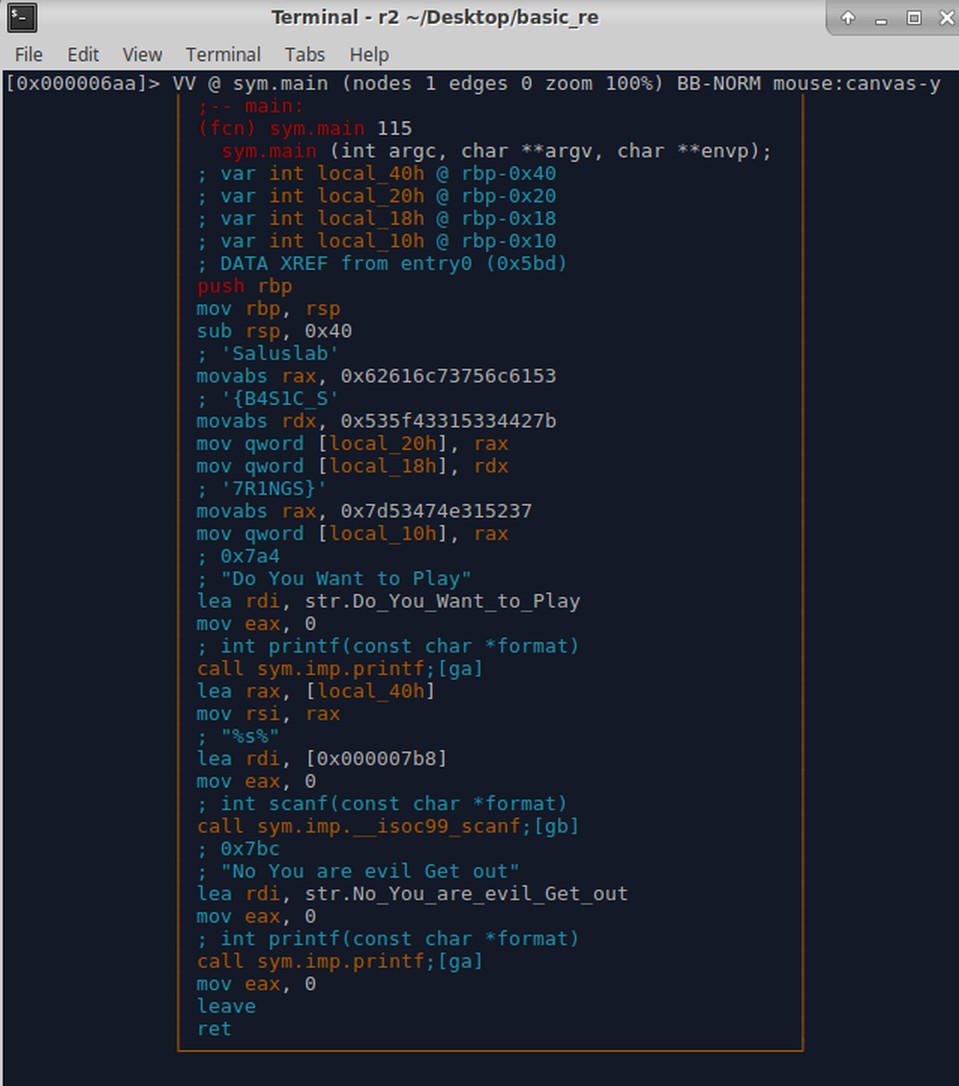
radare2 Graph view of main( )
If you look closely, you'll see parts of the flag up there. (inserted as comments by Radare2)
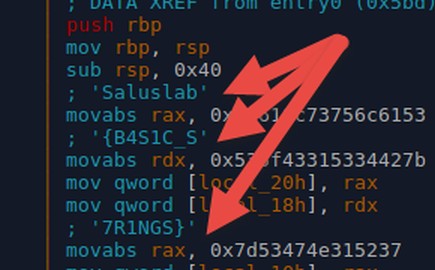
the Flag in r2's comments
So basically we got the flag. But our goal here is to learn more, not just to pass this challenge. So here is a quick explanation:

explanation of the calls inside this function
The Orange box:
- Runs "printf" function with some string as an argument. This string is "Do You Want to Play" .
Yellow box:
- Copies the address of local buffer (local_40h) into argument 2.
- Copies the address of the format string (%s%) into argument 1.
- Runs "scanf" function with arguments 1 and 2 to take our input.
Red box:
- Runs "printf" function with some string as an argument. This string is "No You are evil Get out"
Then we exit the main( ) function using Leave and Ret instructions.
.
So there is no control flow here. Meaning that our input doesnt influence the behaviour of this applications. But the flag is stored in this function's local variables (local_20h, local_18h and local_10h) which is on the function's stack.
_____
To understand the concept of local variables better, lets pop up GDB and inspect the local variables on the stack with our own eyes.
run basic_re in GDB
Lets run it once using "run" command, then type anything when it asks for input. The process will then terminate successfully. (the red box)
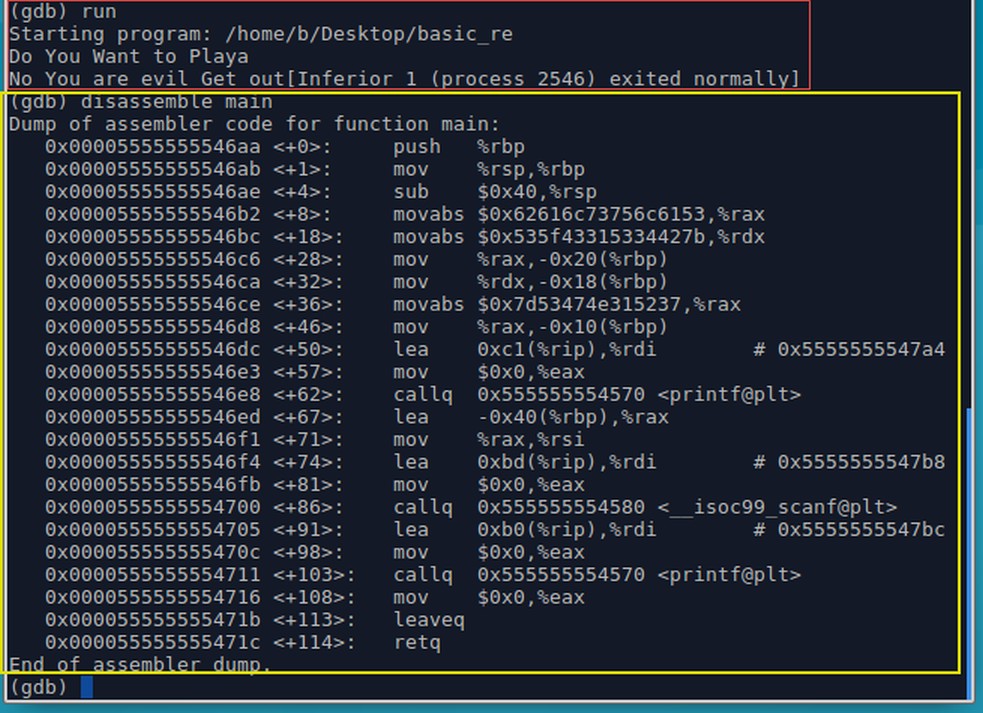
"run" in GDB.
"disass main" in GDB.
Lets disassemble the main function : disassemble main. (the yellow box).
The code looks a bit strange because this is AT&T's assembly syntax. We could tell GDB to use the Intel's assembly syntax, but we wont need to do that here.
Our plan now:
- Put a breakpoint right after the program stores the flag in the local variables on the stack (local_20h, local_18h and local_10h)
- Run the program, it will stop at the breakpoint
- Inspect the stack, to see if the flag is really there
1- Breakpoint
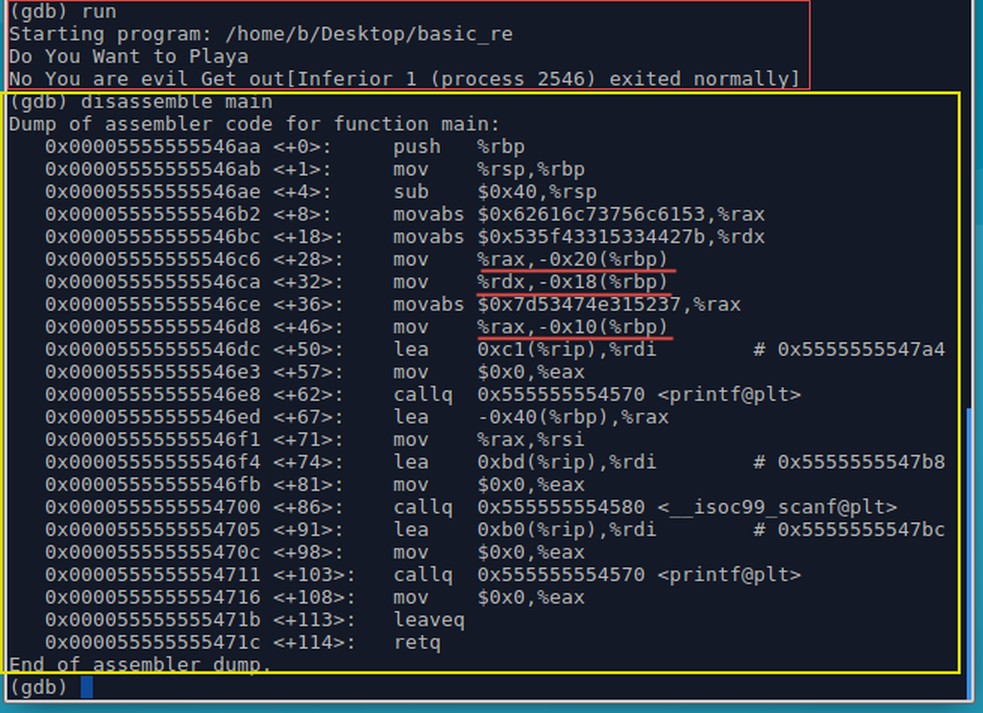
the 3 "mov" commands that copy the Flag into the local variable
We should insert the breakpoint at address "0x00005555555546dc" which is right after the 3rd command (3rd red line in the image above) that copies the flag into our local variable.
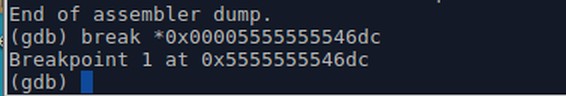
"break *" to set breakpoint at some address
2- Lets run it. It hits the breakpoint
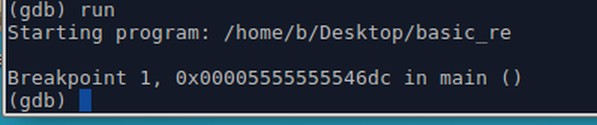
"run" to run the binary.
our BP is hit
Check the registers, we want to see the value of RSP (Stack Pointer, which points to the top of the stack). This step is not required, but it shows how to check registers' value ?
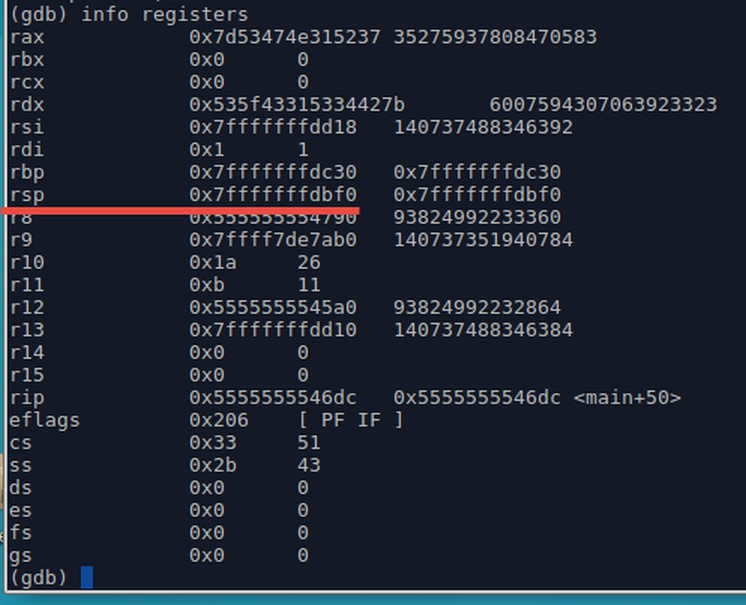
"info registers" to print out all registers' values
3- Lets examine the values at the top of the stack (using the command x). I'll use the command "x/30g" to examine 30 values at the top of the stack, each value is "g" (Giant words) because this is a 64-bit binary. (we would use x/30w if it were a 32-bit binary).

"x/30g" to eXamine 30 Giant words (64-bit)
Anything familiar? Probably not..
How about we ask GDB to print those values as Strings?
We do that using "x/30s" instead of "x/30g"
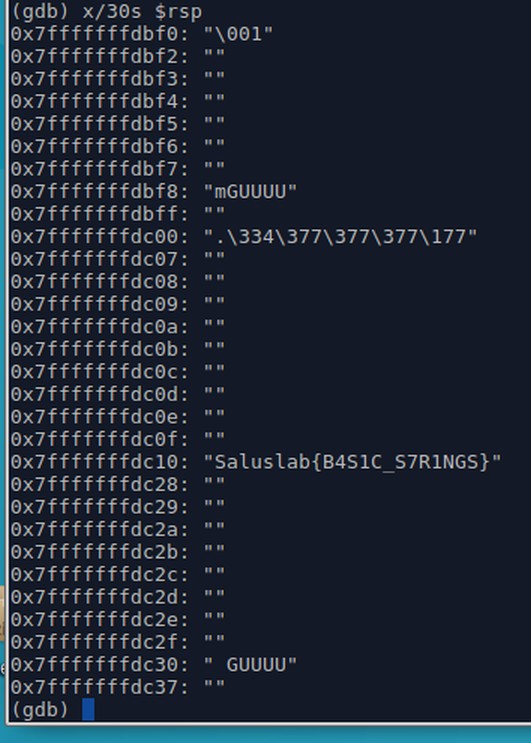
"x/30s" to eXamine 30 Strings
That's our flag right there..
Pretty cool, right?
.
Now the steps you should try by yourself..
- Continue execution of the program line by line in GDB (using "next" or "step" commands) after the breakpoint, till you hit the return and exit out of the main function.
- Inspect the stack.
- You wont find the flag there. Why? because the flag was in the function's local variables.. and the stack gets cleaned after the functions returns